Regional EEZ MHW

West Coast
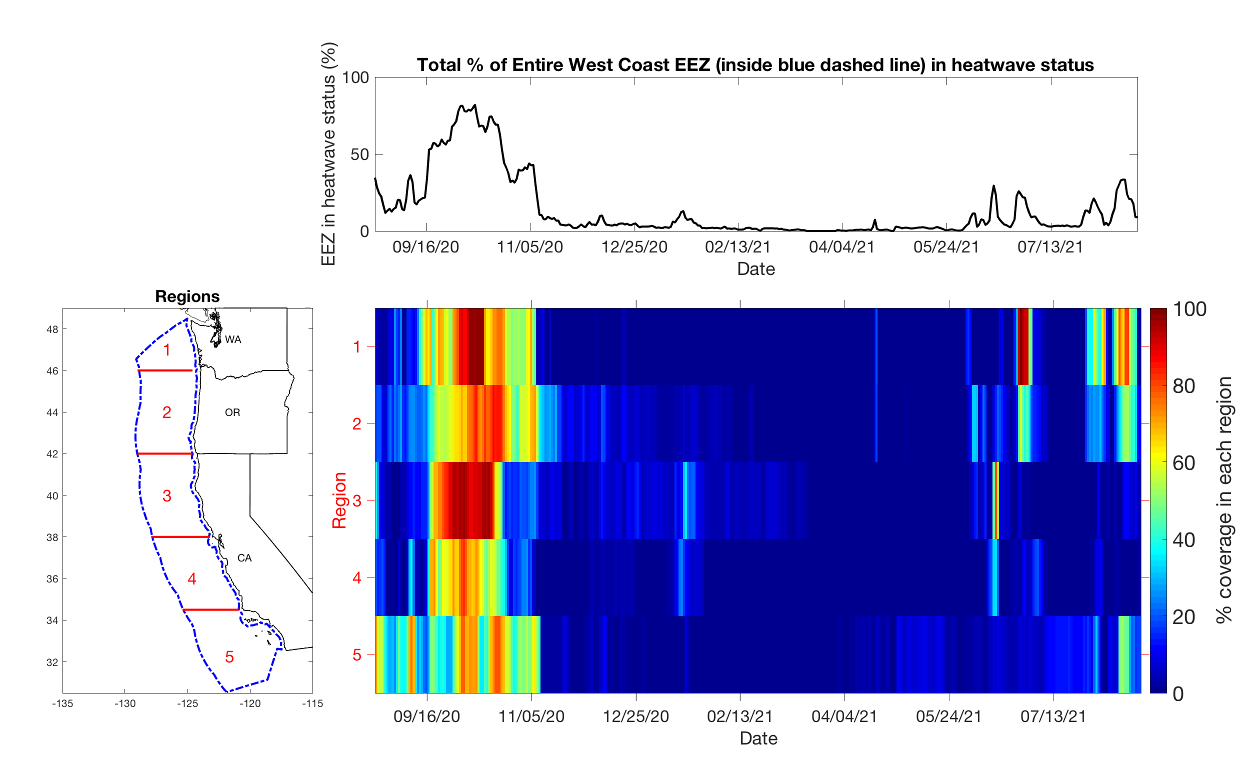
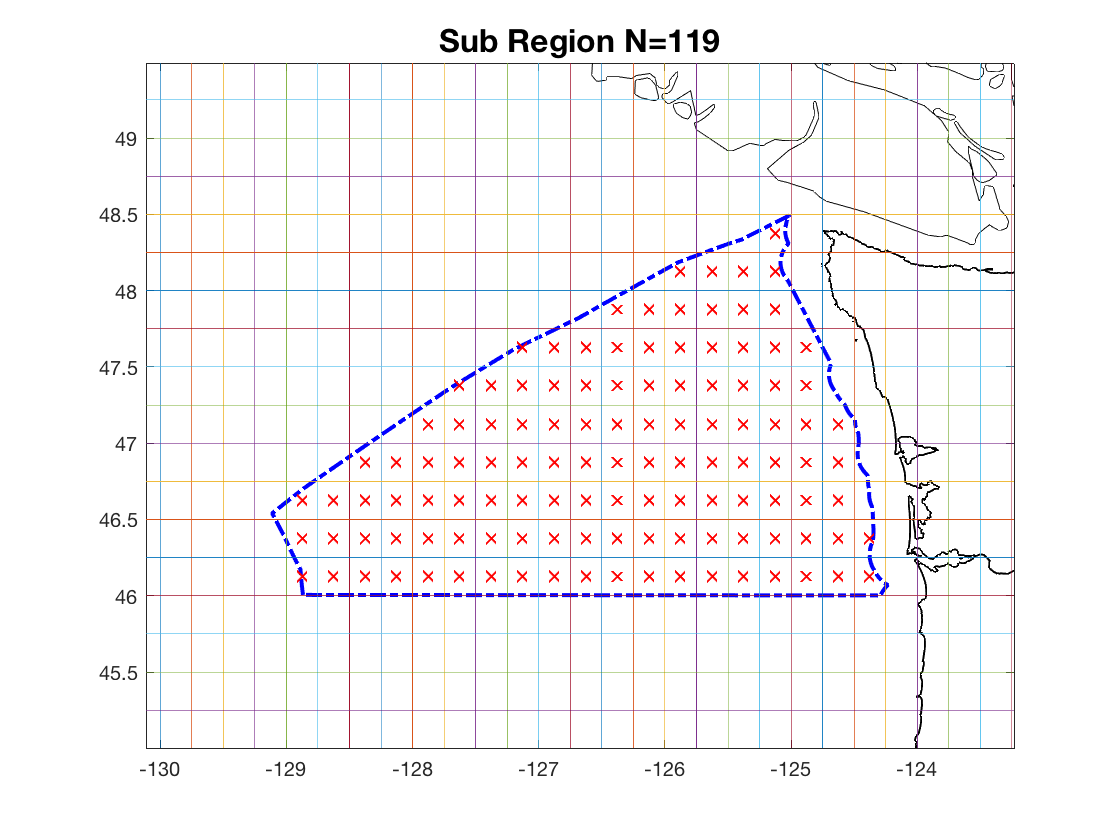
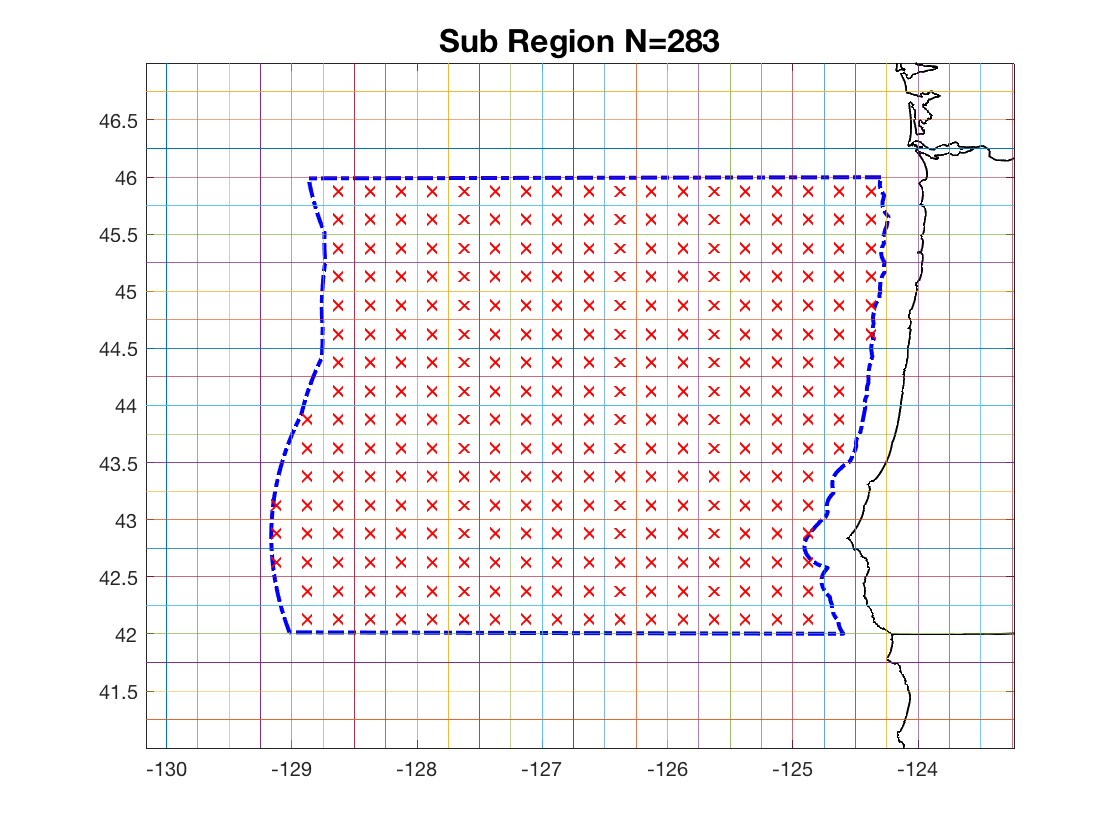
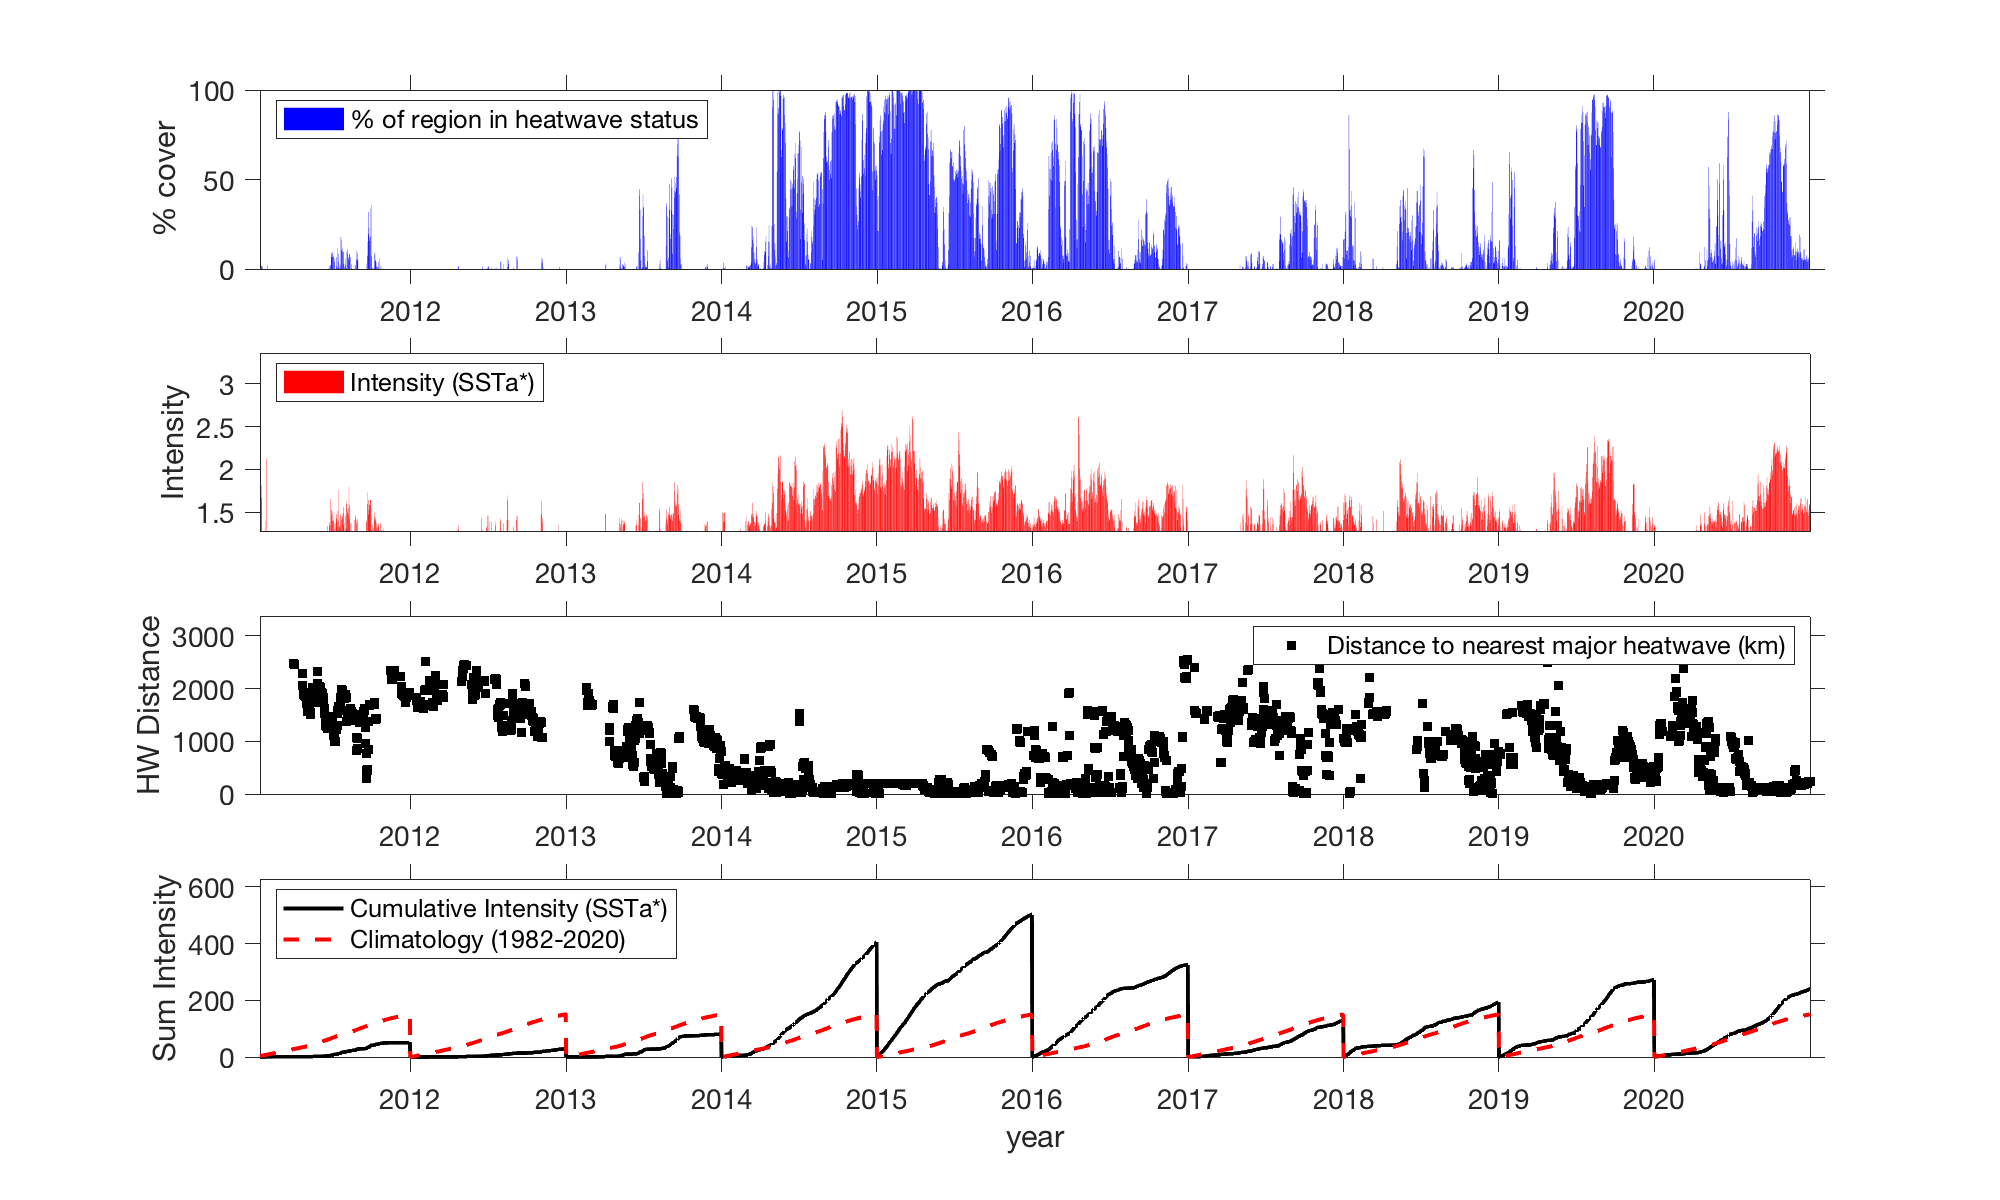
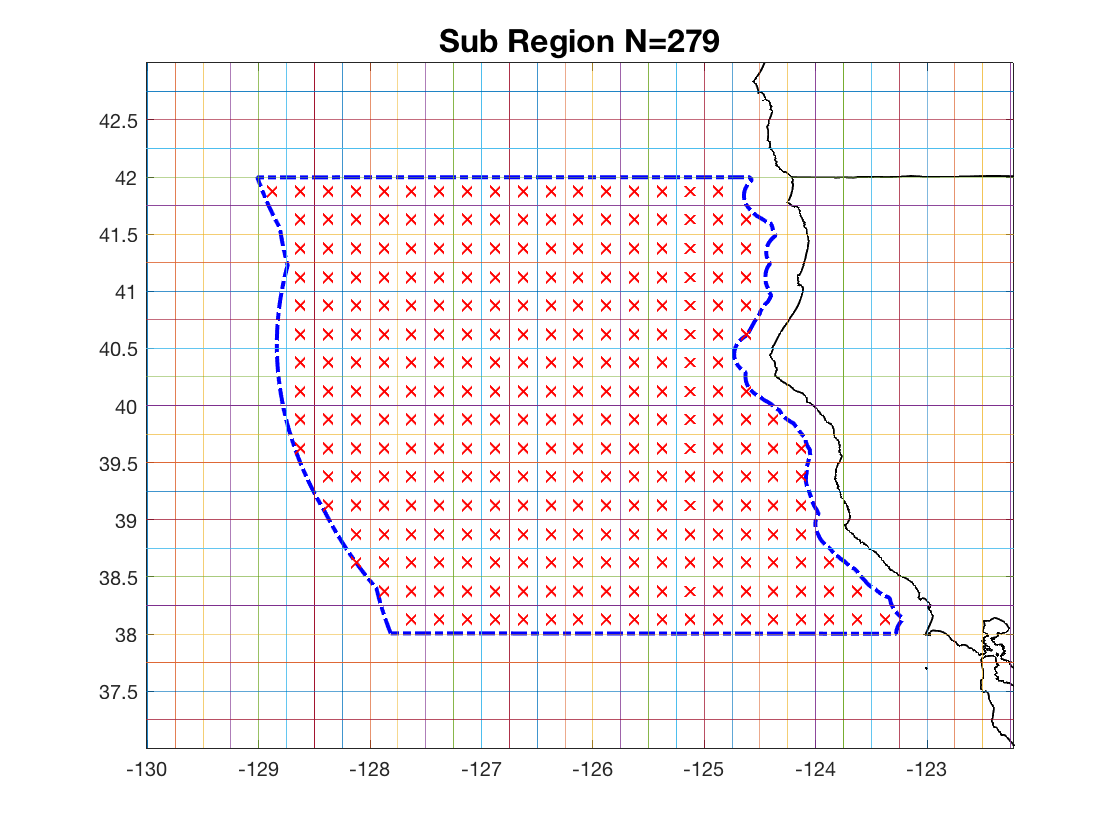
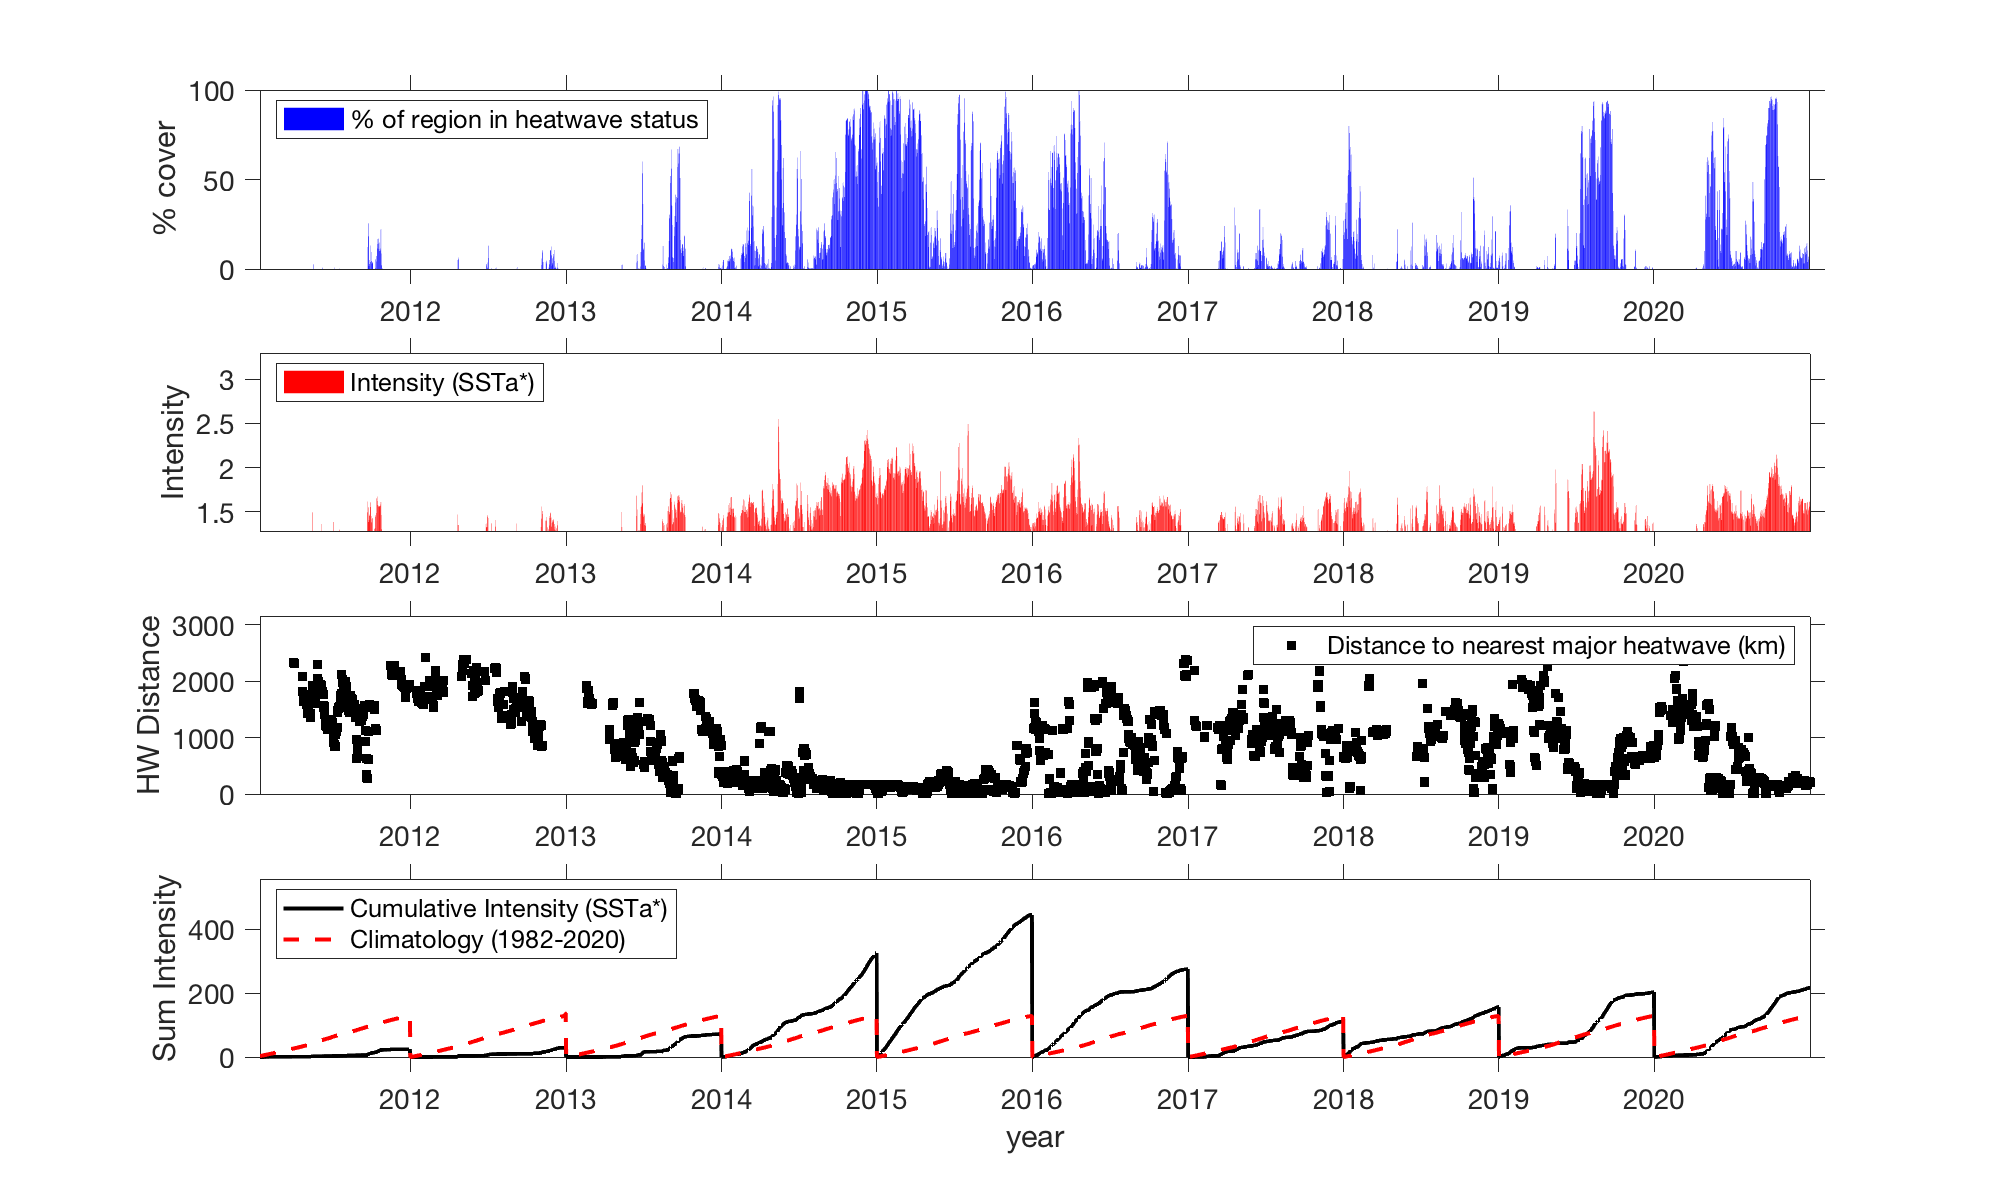
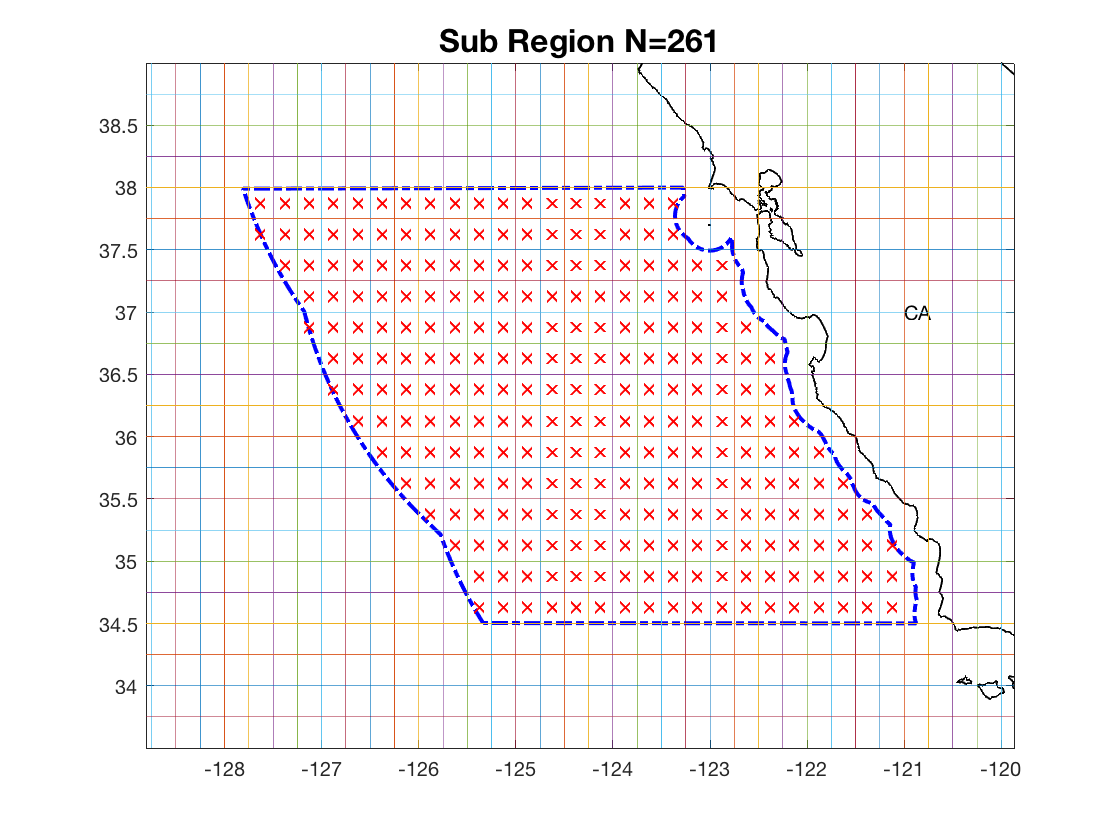
Top graph shows the total % of the US west coast EEZ (not including waters off of Alaska) that is classified as in “heatwave” status over the past 6 months. Left lower panel shows the region covered by the EEZ (blue dashed line) and then subregions: WA (1), OR (2), northern CA (3), central CA (4), and southern CA (5). Lower colored panel indicates the % coverage within each subregion that is in heatwave status.

Washington

Download Washington daily data
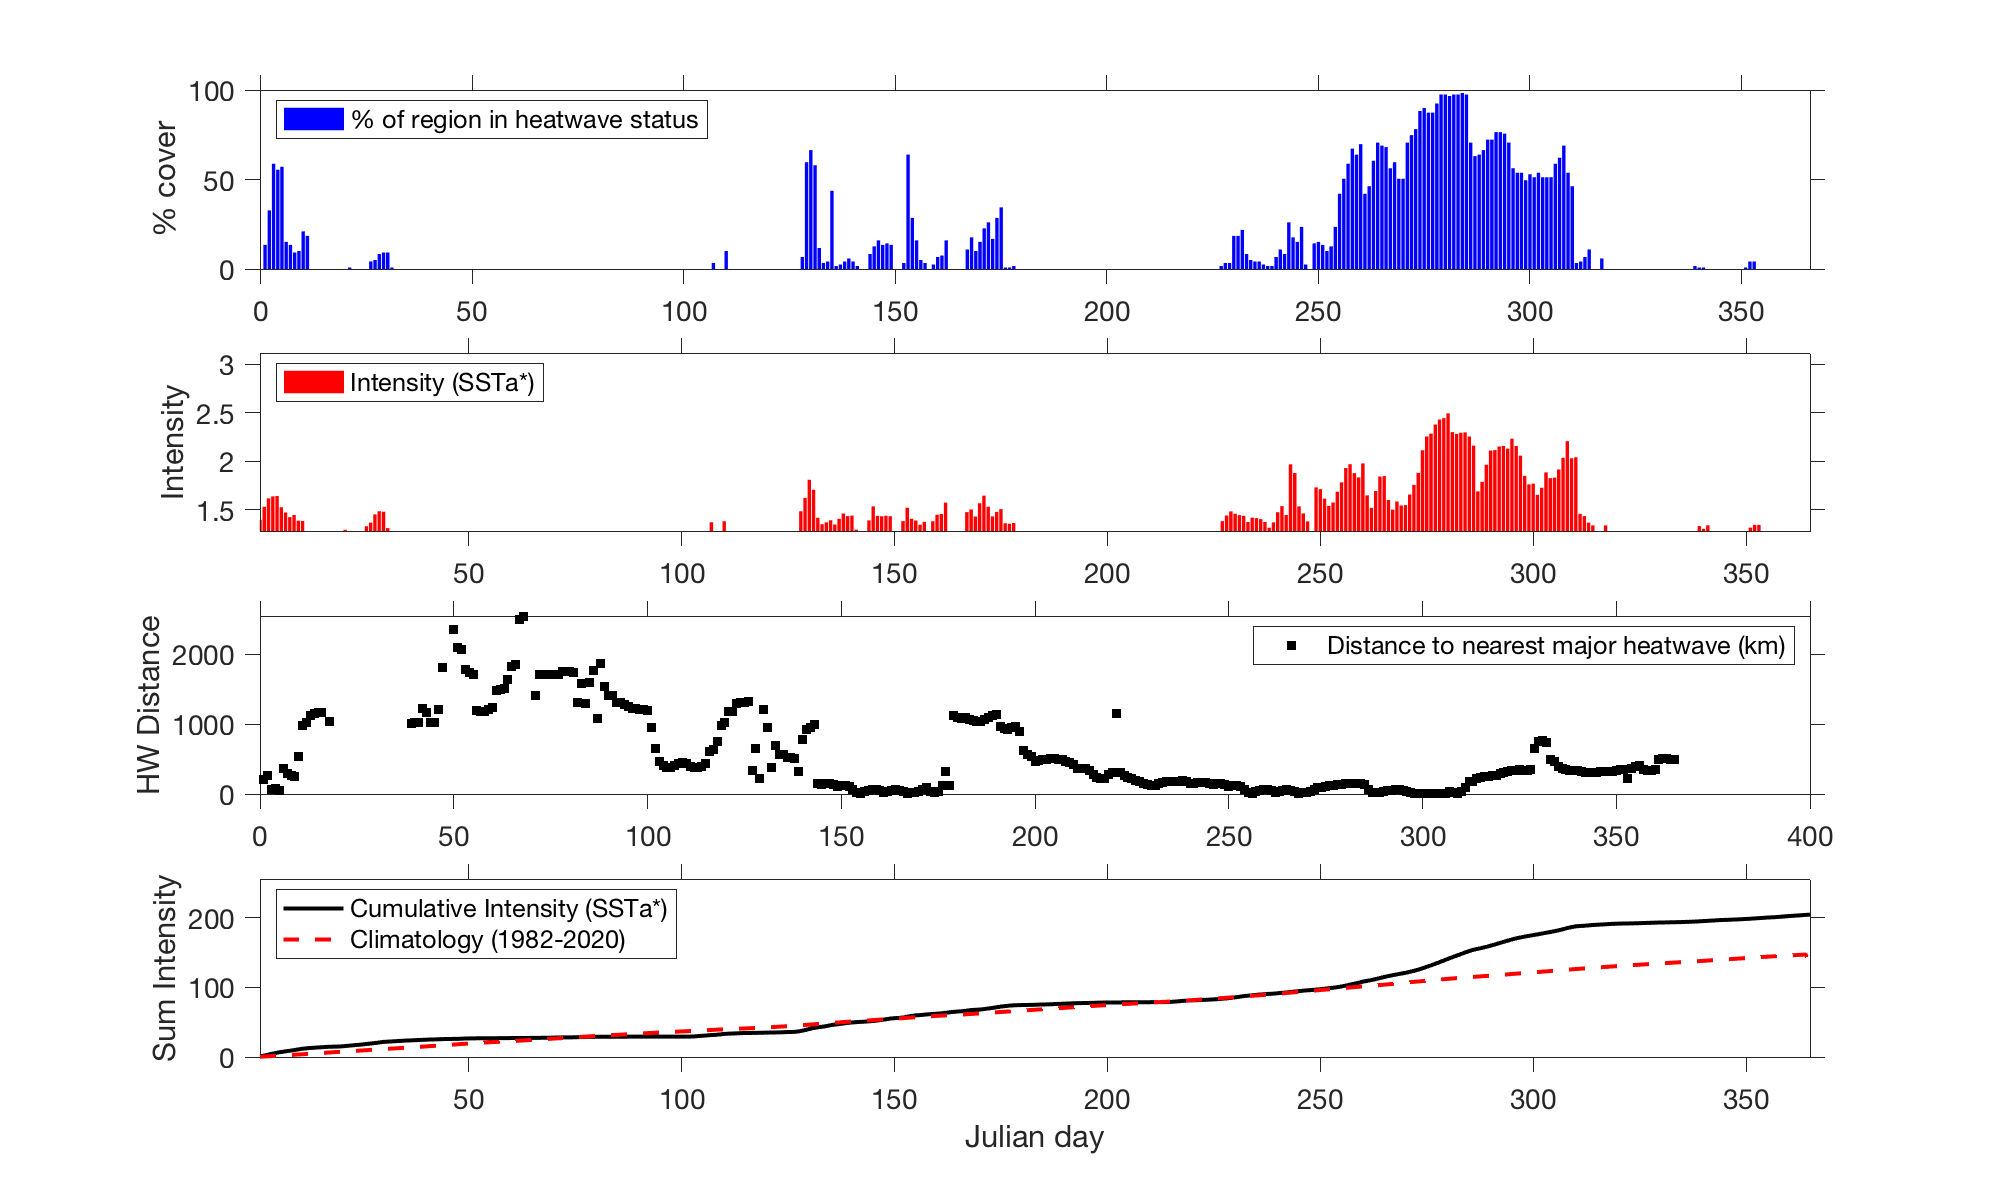
Washhington 1-year graph

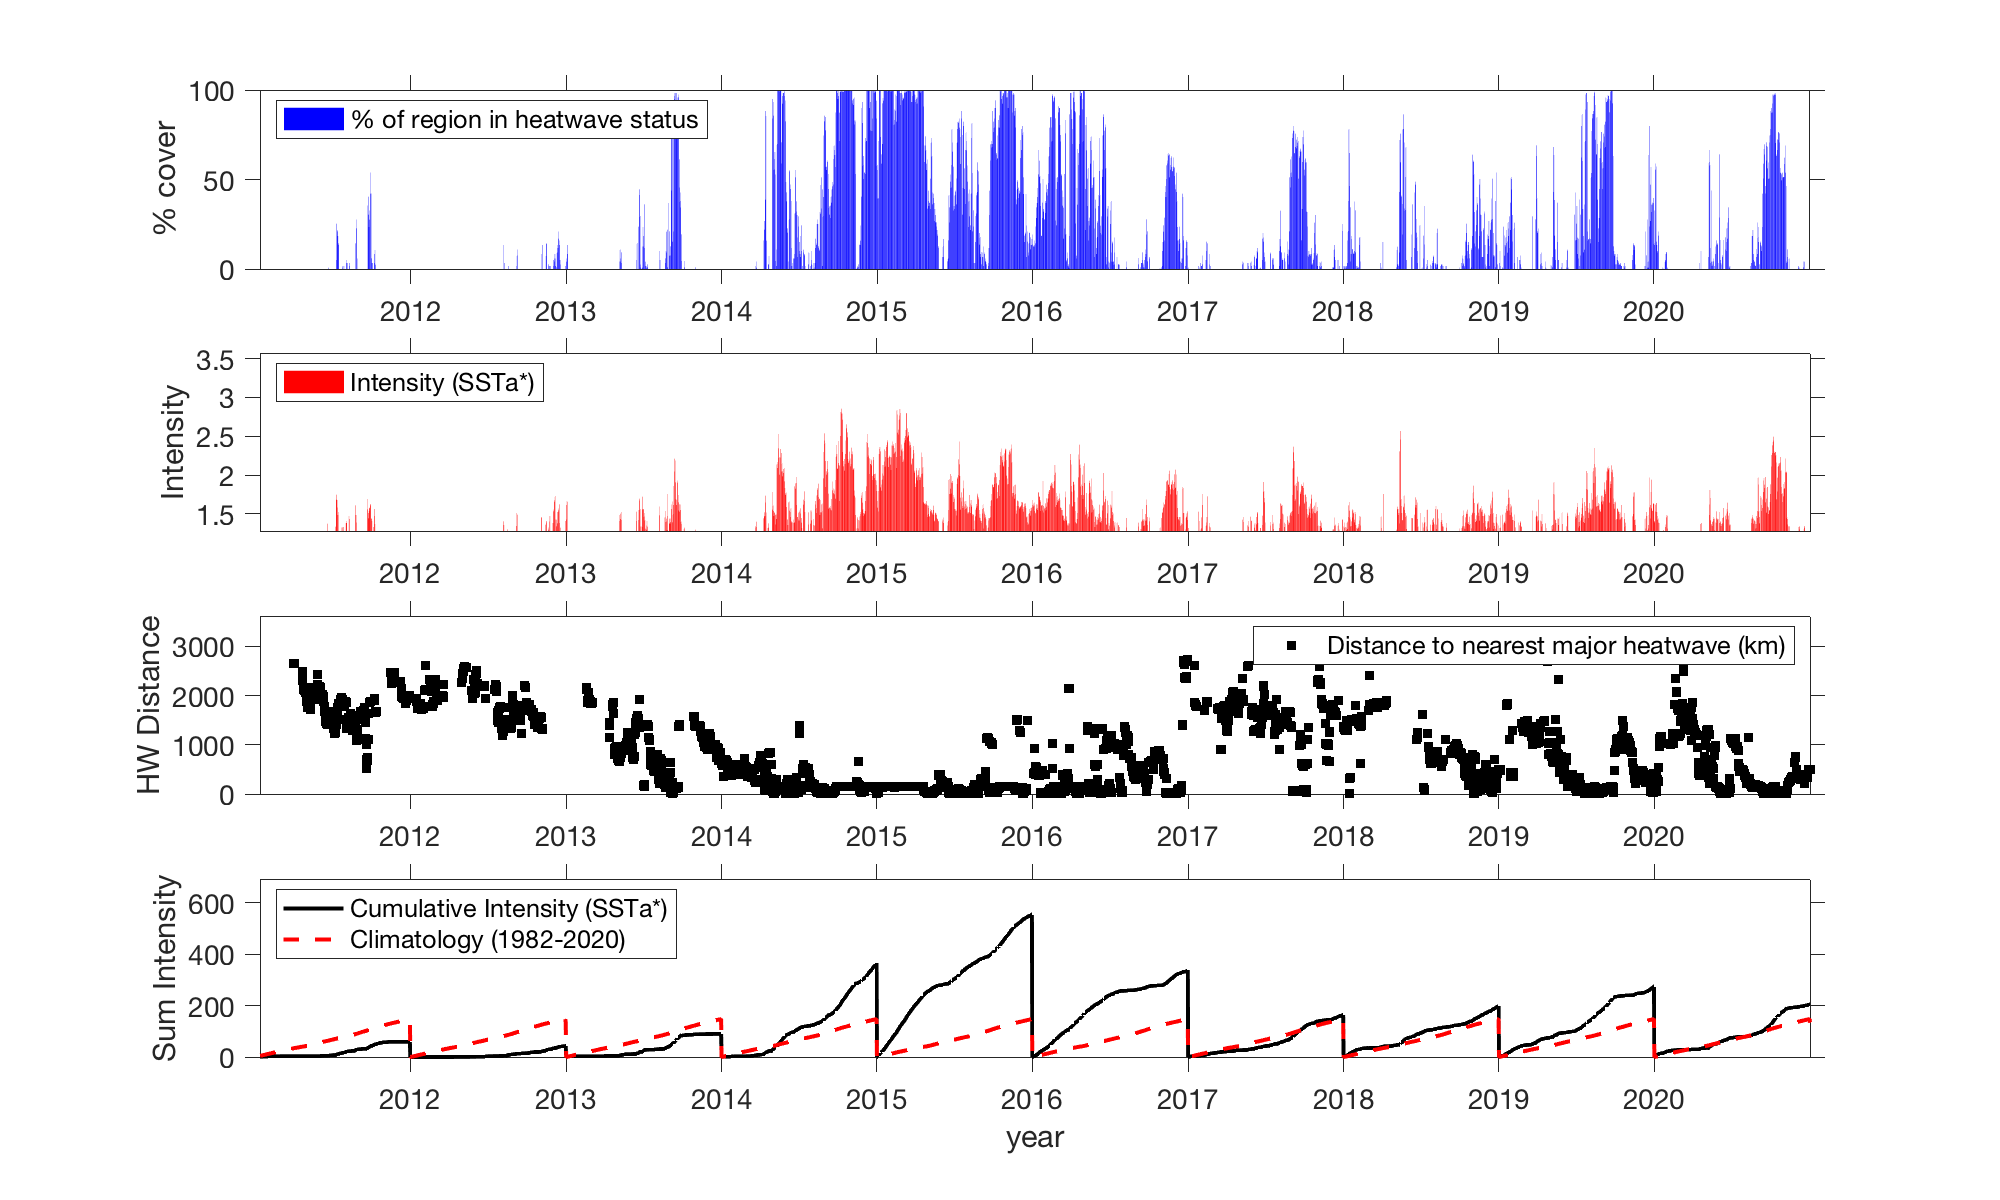
Washhington 10 year graph

Oregon

Download Oregon daily data

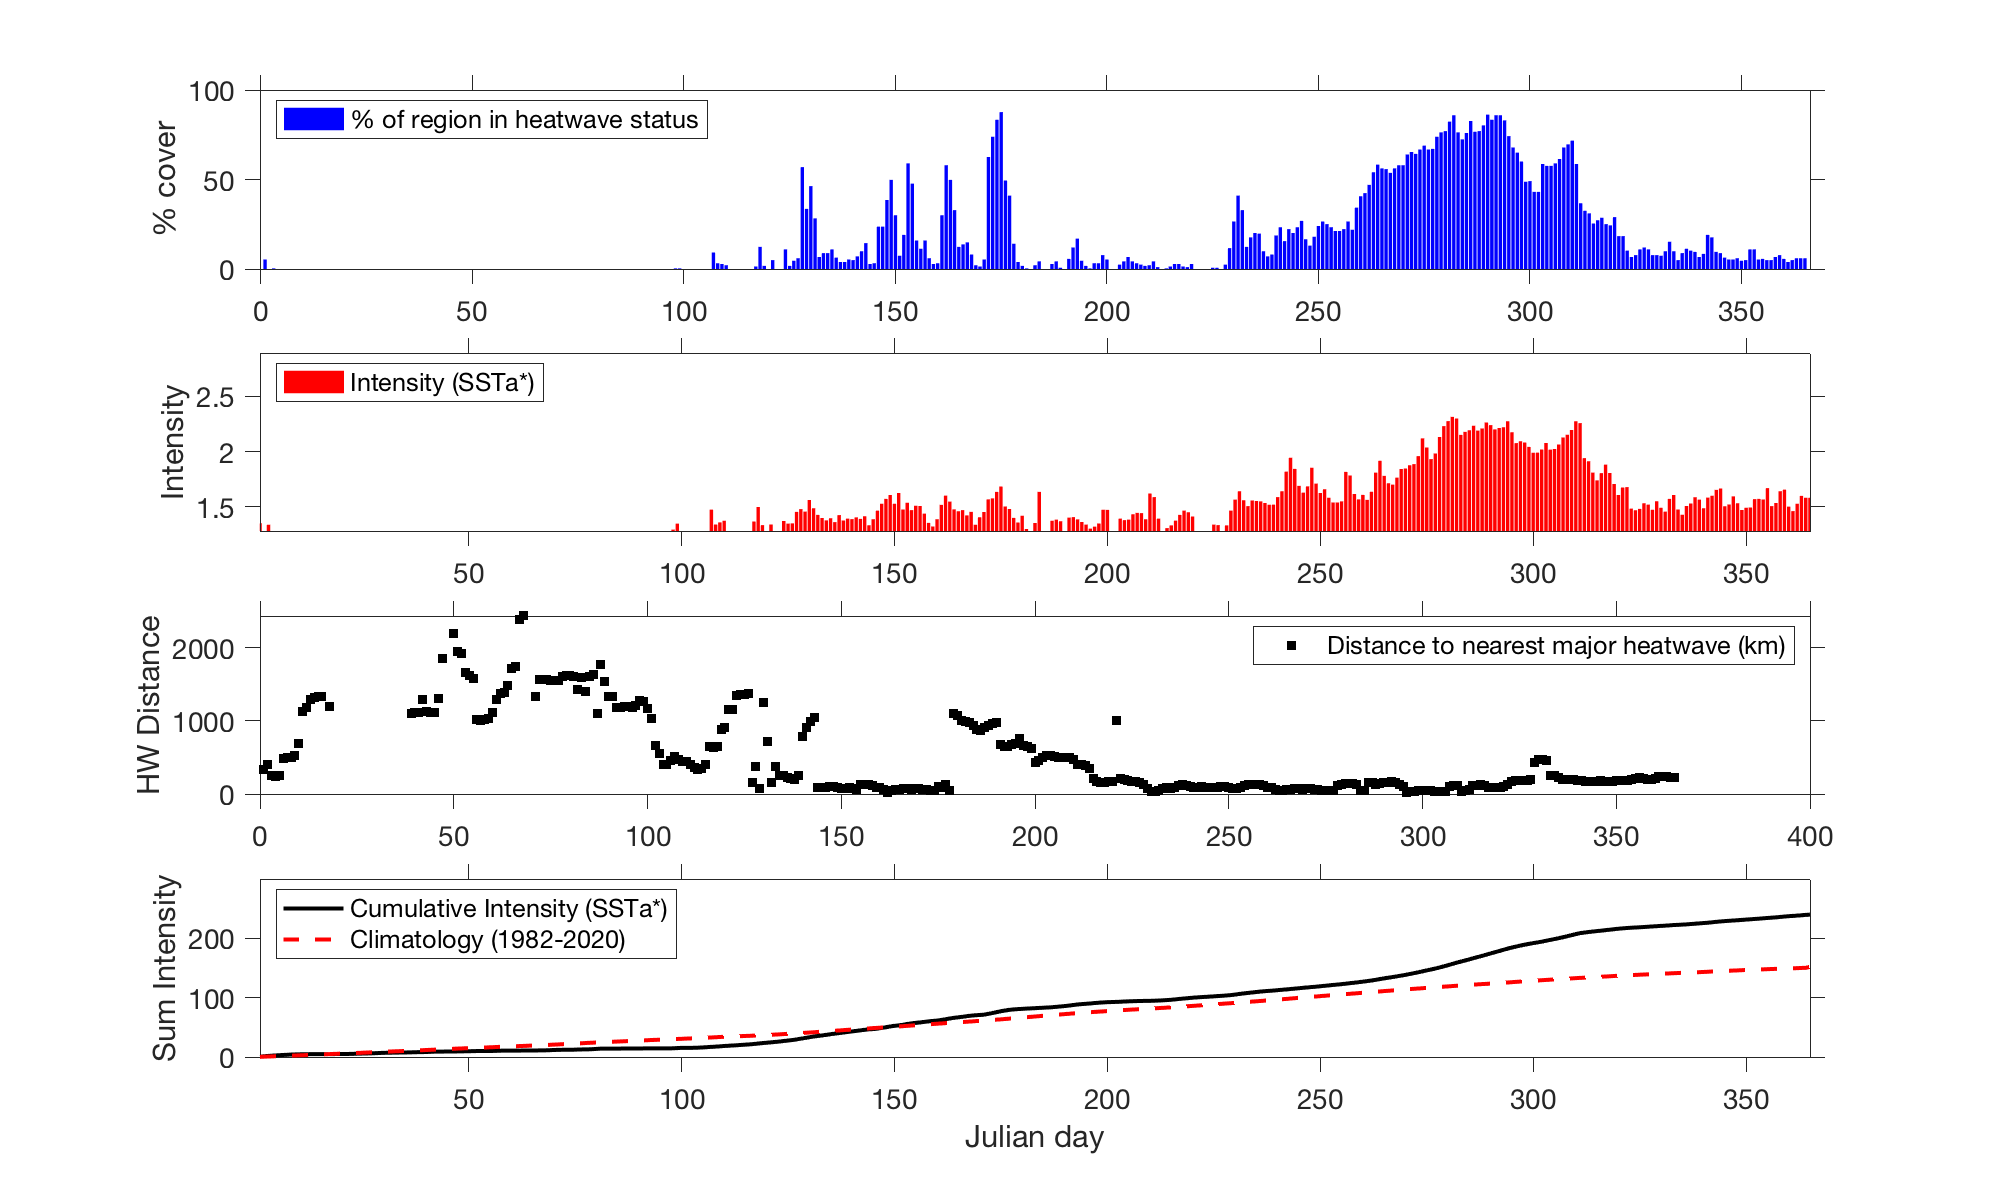
Oregon 1-year graph

Oregon 10 year graph

Northern California

Download Northern California daily data
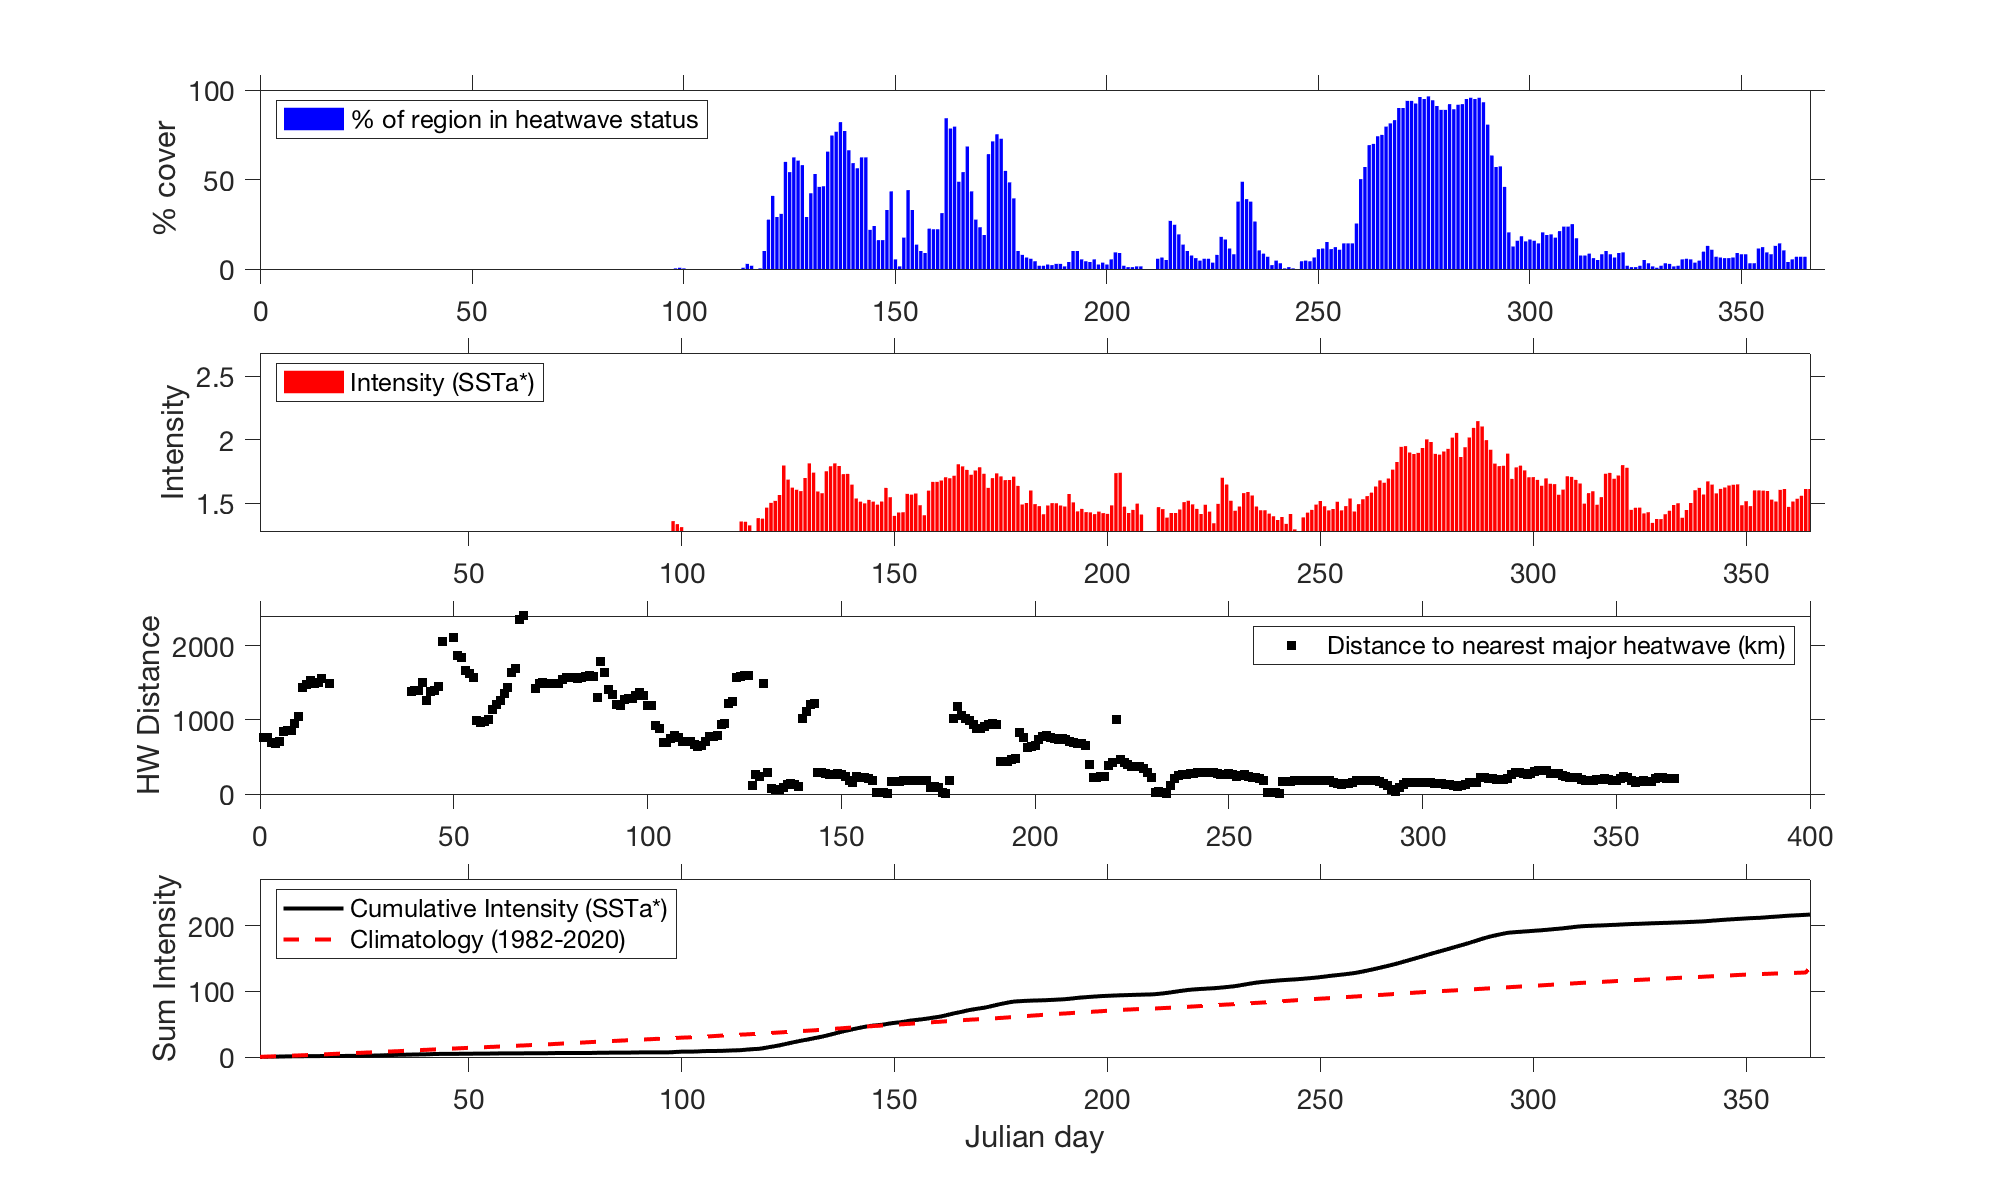
Northern California 1 year graph

Northern California 10 year graph

Central California

Download Central Californian daily data
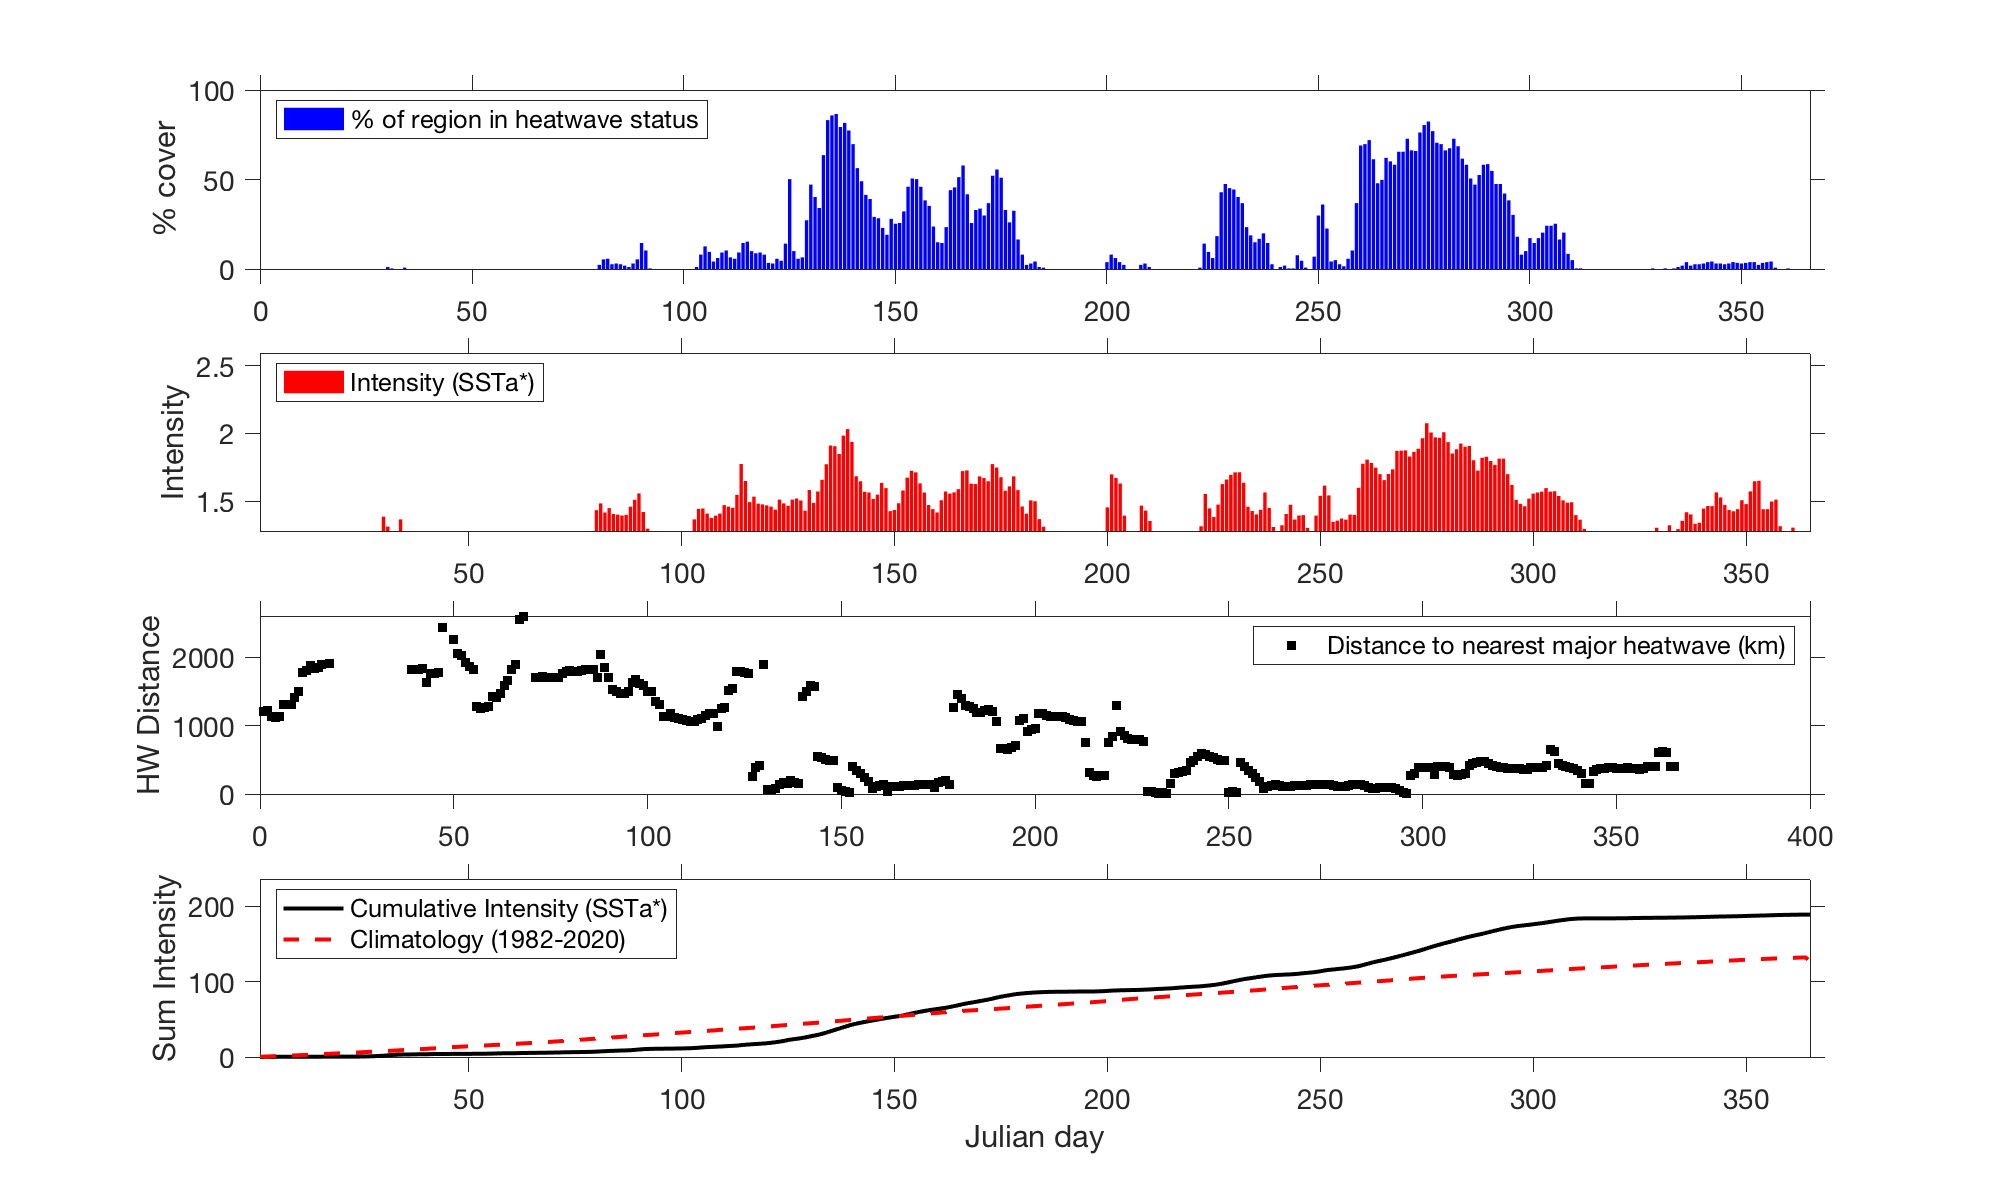
Central California 1 year graph

Central California 10 year graph

Southern California

Download Southern California daily data
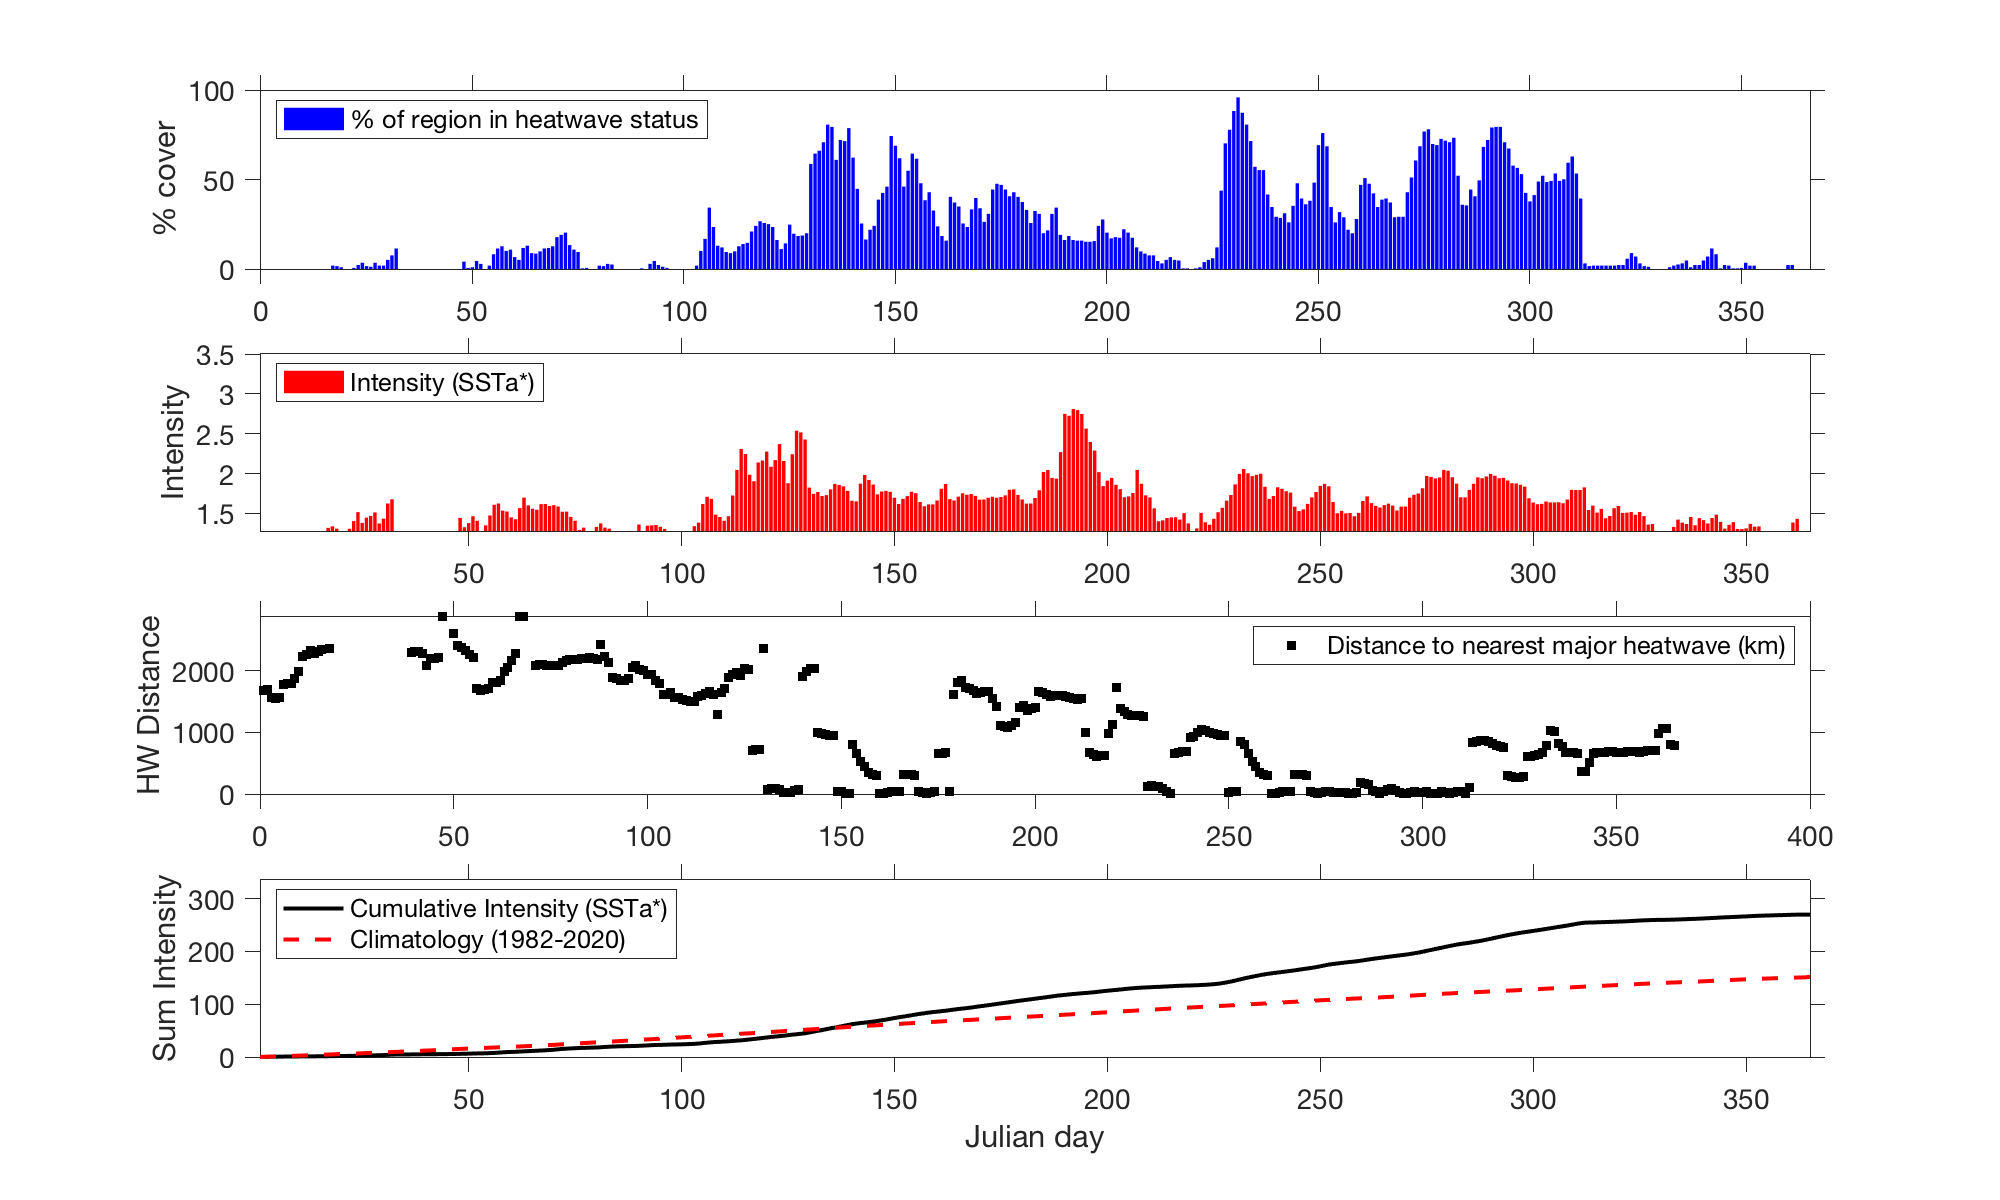
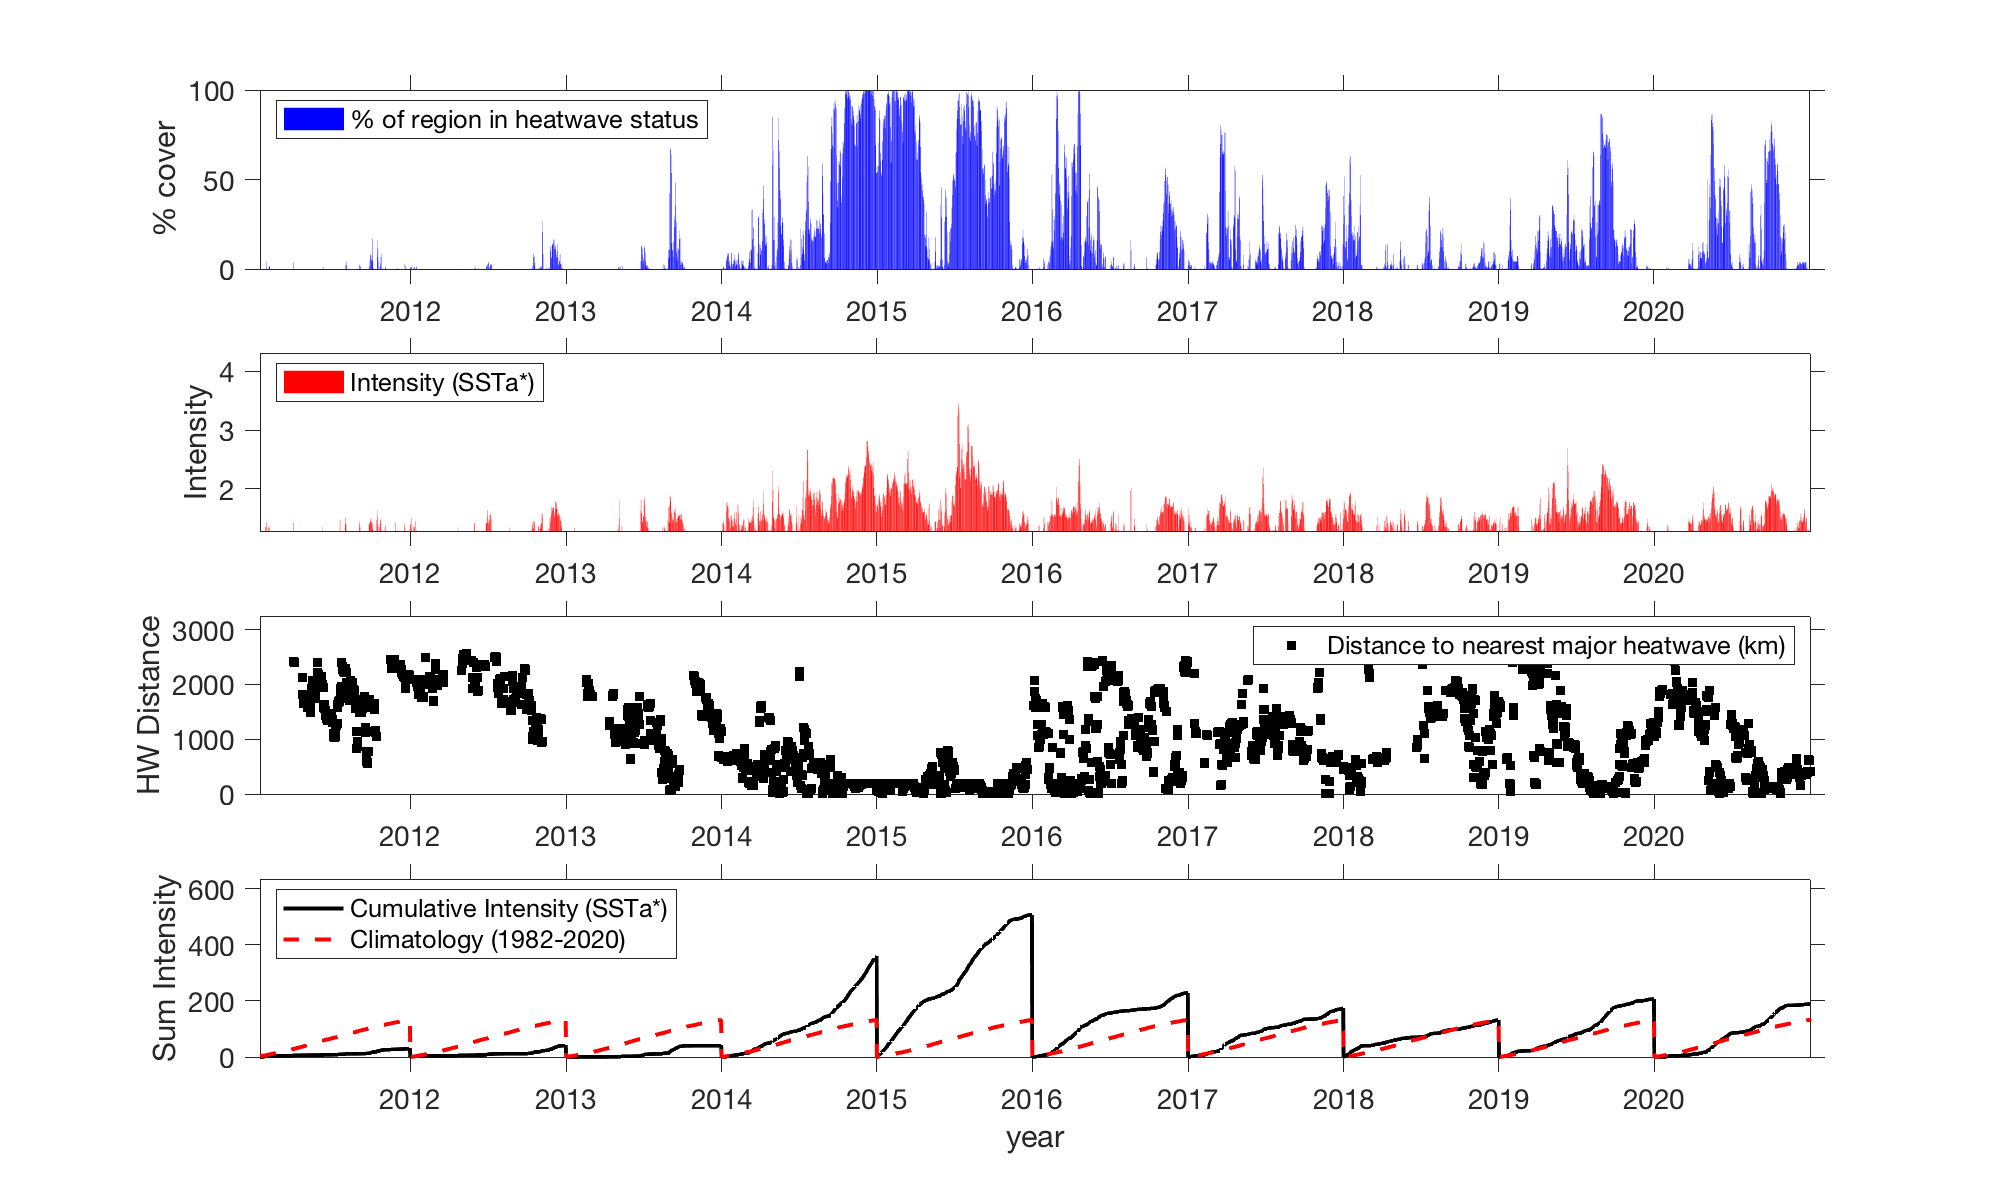
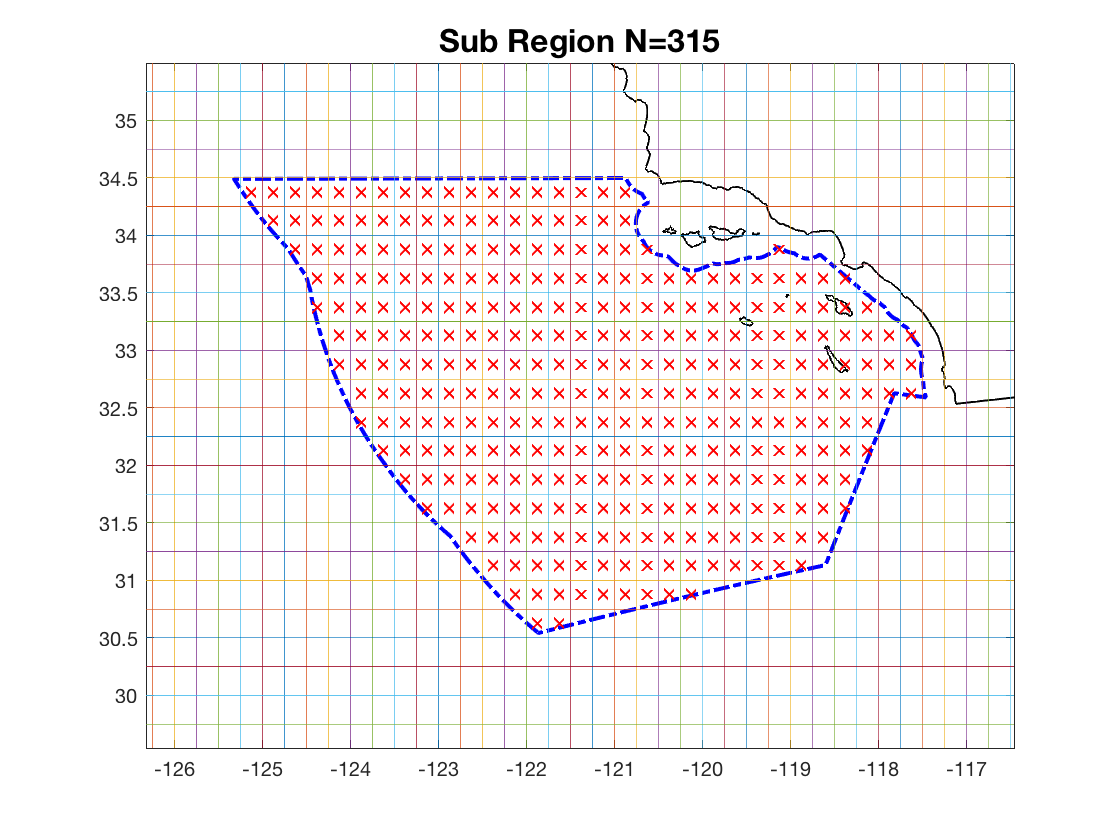
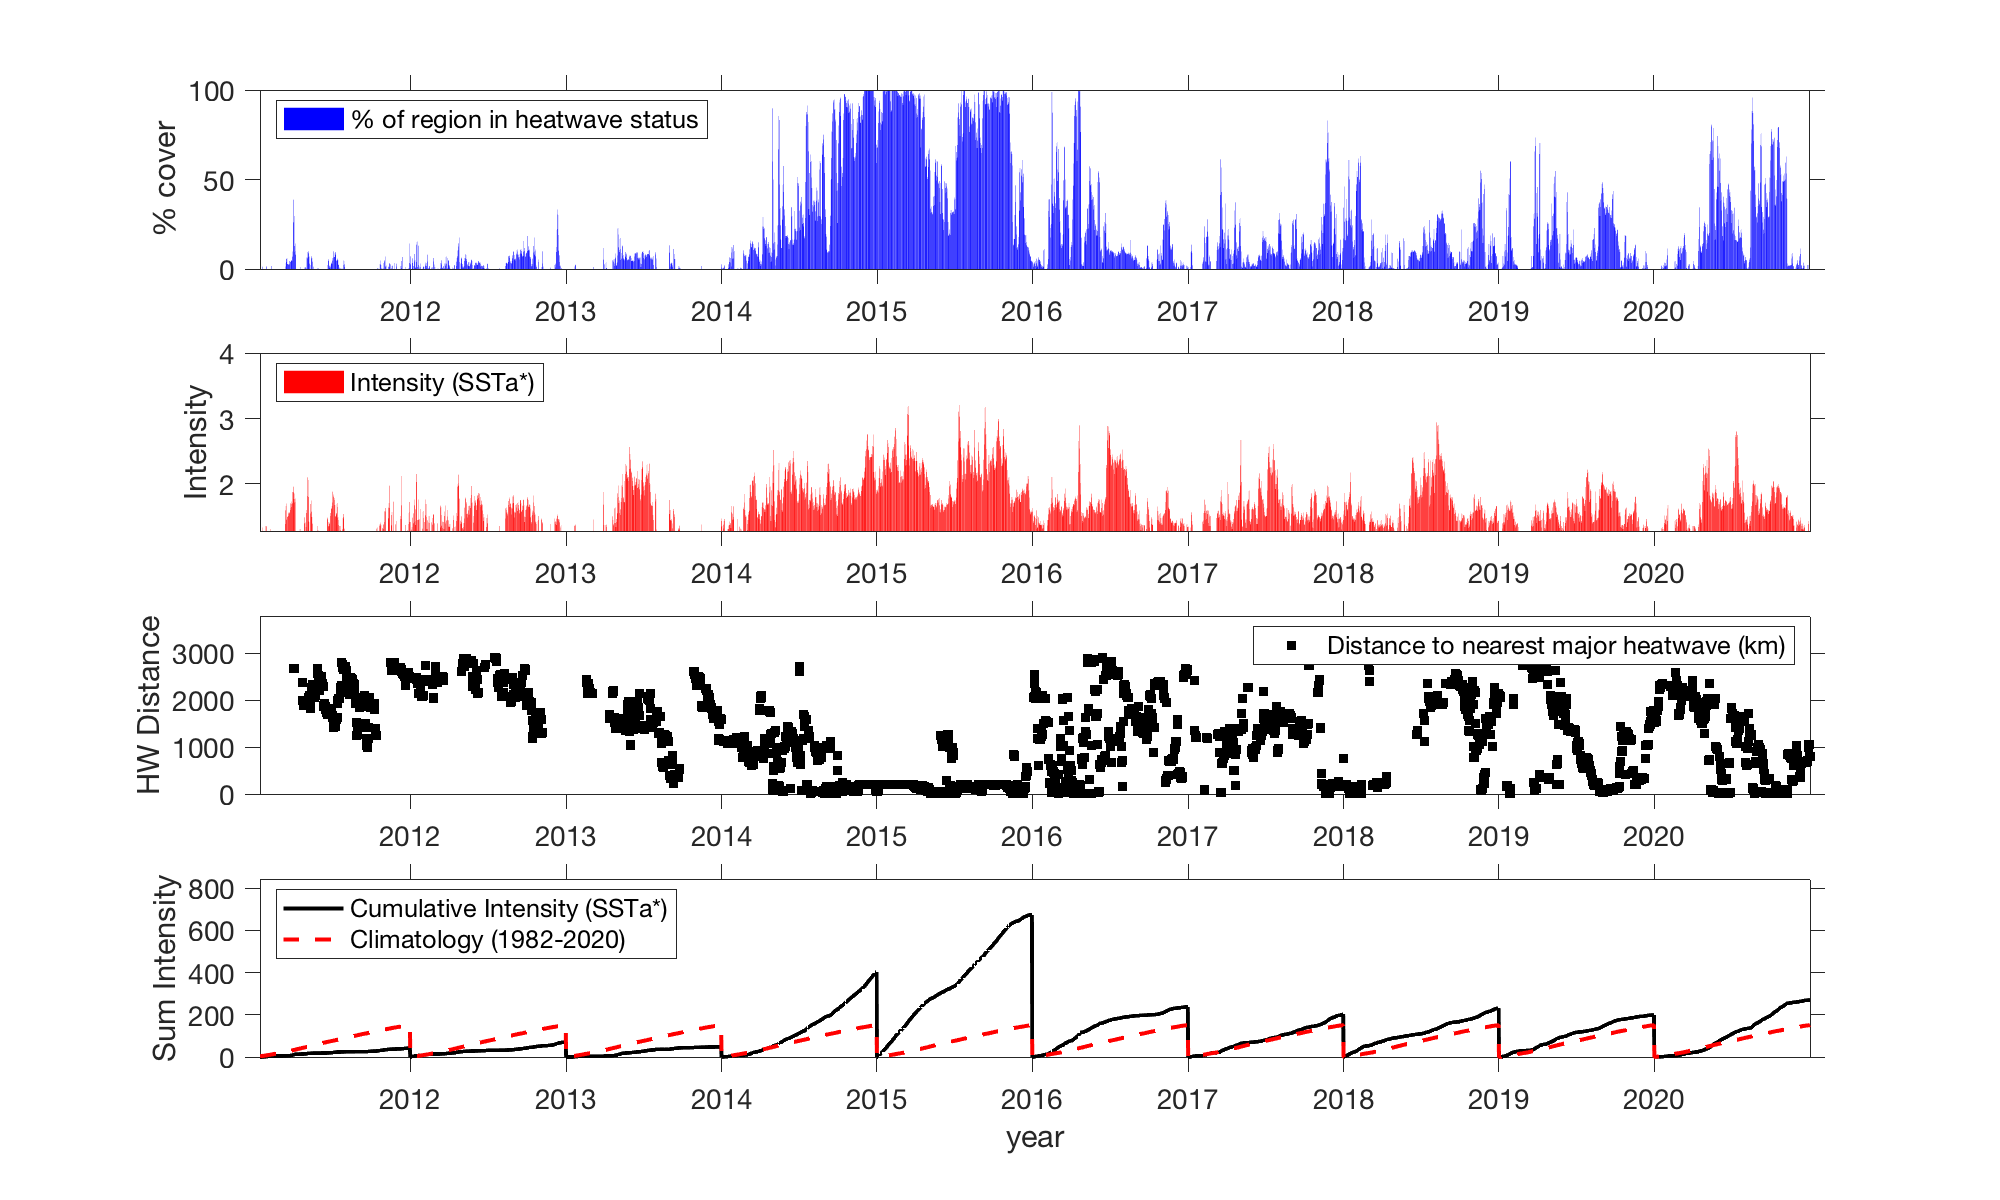
Southern California 1-year graph

Southern California 10-year graph
Back to top